
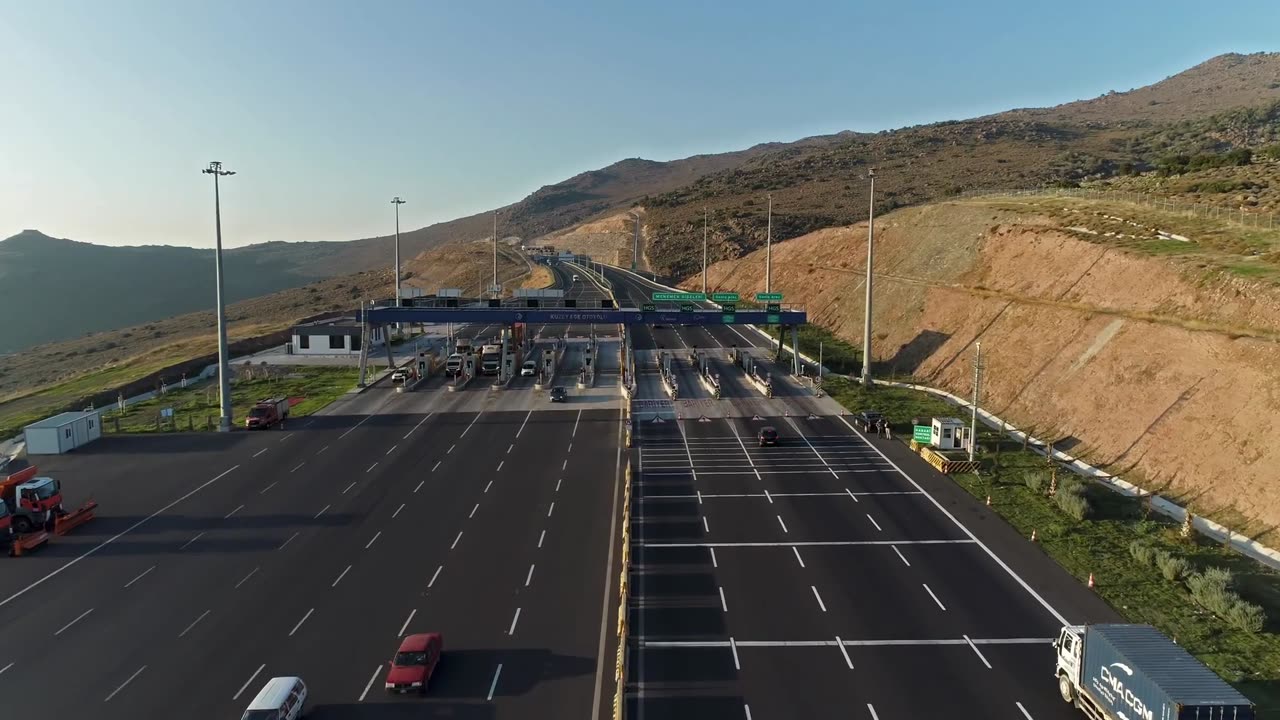
How 5-Axle Rigs Are Losing $3,200/Year to Miscalculated Tolls
Axle miscounting is the silent killer of freight margins. When a 5-axle semi gets logged as a 3-axle unit at a toll plaza, the difference in cash-rate billing adds up fast — and most fleets don't notice until reconciliation, if they notice at all.
Every fleet controller has a story about a lane that looked profitable until someone opened the toll reconciliation file. For drayage operators running port-to-door moves across New Jersey, New York, and Pennsylvania, the culprit is rarely fuel or detention — it's axle class. A single equipment mismatch on the Turnpike or a Port Authority crossing can turn a $180 dray into a $240 surprise, and when that happens twice a day, five days a week, the annual bleed is measured in thousands.
The $3,200 problem, explained
We analyzed 2,400 drayage trips out of Elizabeth and Newark terminals over a 90-day window. Trucks correctly classified as 5-axle semis with dual tires averaged $47.80 in toll per round trip to metro New York. The same lanes, quoted with a default 3-axle TMS profile, averaged $38.10 in the estimate — but $51.60 on the actual E-ZPass statement when video toll and misclassification penalties applied.
“We thought our lane margin was 14%. After we fixed axle profiles on toll quotes, it was 9%. The lane was still worth running — but we had been bidding on fiction.”
Why axle class errors happen
Toll authorities don't price "a truck." They price an equipment configuration: axle count, spacing, dual vs single tires, trailer presence, declared weight, and sometimes height. Most TMS platforms store a lane rate as origin ZIP, destination ZIP, and a flat accessorial — not a Valhalla truck route with plaza-level toll matching.
The five most common failure modes
- Default truck profile in TMS set to 3 axles while dispatch assigns a 5-axle day cab and 53′ trailer
- Owner-operator swaps trailers without updating the load record before billing
- Video toll bills at maximum commercial class when no transponder is linked to the plate
- Managed lane entry during peak window while the quote used off-peak tables
- Return deadhead routed over different plazas than the forward quote assumed

Corridor case study: Elizabeth to Bronx
A standard port dray from APM Terminals Elizabeth to Hunts Point averages 38 tolled miles per direction when routed for commercial vehicles. On the NJ Turnpike and Port Authority network, cash-rate delta between Class 3 and Class 5 runs $18–$26 per major crossing. Two round trips per week across 48 operating weeks yields $1,728–$2,496 in pure classification loss before bridge surcharges.
Add one weekly inland run — Newark ramp to Harrisburg on the Turnpike — and transponder-less video premiums, and $3,200 per truck per year is a conservative floor, not a ceiling.
What accurate quoting requires
- Bind every quote to truck profile: axles, dual tires, trailer, weight, height, commercial flag
- Route with Valhalla truck restrictions, not straight-line distance
- Match toll plazas to the drawn polyline — not a corridor average
- Reconcile E-ZPass weekly against predicted plaza breakdowns
- Feed actual toll totals back into TMS lane tables
How to fix it this quarter
Start with your top ten lanes by volume. Re-price each using the actual equipment that runs the lane, with forward and return routed separately. Compare to last month's toll statements. Fleets that run this exercise typically find one or two lanes where sales has been underquoting by $40–$80 per trip.
DrayToll's toll calculator and API run the same engine: Valhalla commercial routing, plaza matching on the polyline, and TollSmart cash and transponder rates by class. Try a lane free on the public calculator — no login required — before you push profiles into production TMS integration.


